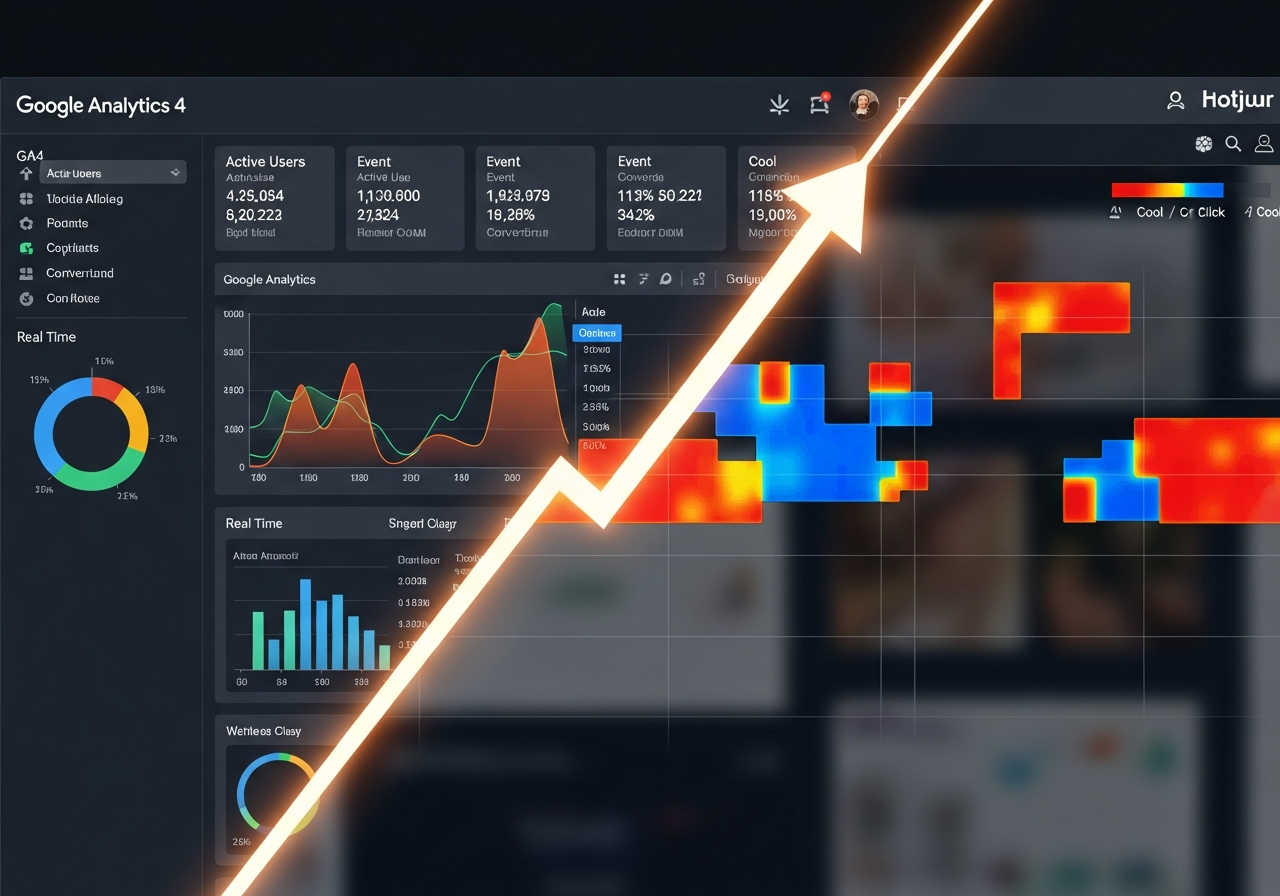
If there’s one thing 2025 has made painfully clear, it’s this: your website isn’t just a digital address — it’s a living, breathing part of your brand’s growth engine. And like any engine, it runs better when you actually look under the hood.
Most brands don’t.
They publish pages, tweak headlines, obsess over color palettes… yet ignore the very tools that reveal what’s really happening behind the scenes.
And that’s where analytics — Google Analytics, Hotjar, and a few smart insights — quietly become your biggest competitive advantage. In a world where every business is fighting for attention and every click costs money, analytics isn’t just a digital marketing strategy; it’s your compass in the chaos.
Let’s break down how these tools help you understand your audience, fix friction points, and create the kind of user experience that actually converts.
Why Analytics Matter More Than Ever in Digital Marketing
Consider this: You can spend lakhs on ads, SEO, and content… but if your website doesn’t guide people correctly, you’re pouring water into a leaking bucket.
Analytics fills the gaps.
It shows you why people bounce, where they drop off, and what they really care about. It shifts you from guessing to knowing.
A mid-tier SaaS brand we worked with discovered something shocking through Hotjar heatmaps — users were clicking a non-clickable icon, assuming it was a key feature. The brand had spent six months optimizing headlines while the real problem sat quietly in their UI. Fixing that single issue improved conversions by nearly 28%.
That’s the power of analytics: it reveals truths your intuition can’t.
And the brands that embrace data over assumption are the ones winning the digital battlefield in 2025.
Google Analytics: Your Website’s Performance Storyteller
Google Analytics (GA4) isn’t just a reporting tool — it’s a narrative engine. It tells you who your visitors are, how they behave, and what makes them leave or stay.
Most brands only look at surface-level metrics like “Users” and “Sessions,” but real internet marketing insights come from the deeper layers:
1. Traffic Sources → “Who sent them here?”
You’ll notice patterns you couldn’t see before. Maybe your Instagram drive looks strong but barely converts, while that small backlink you earned from a niche blog brings high-value traffic.
Here’s the kicker: not all traffic is equal. Analytics shows you which channels actually produce ROI.
2. User Behavior → “What do they do next?”
GA visualizes your user flow — the path people take through your website.
If most users drop off after your pricing page, that’s not a coincidence; it’s a message.
A client once asked why their Google Ads weren’t scaling. GA4 revealed what the ads team couldn’t see: customers were losing trust because the landing page loaded slowly on mobile. A 1.5-second delay was eating nearly 40% of their conversions. Fixing the lag cost them nothing; ignoring it was far more expensive.
3. Conversion Tracking → “Are your goals aligned with user intent?”
Tracking micro-conversions — clicks, scrolls, downloads — often reveals that users want to convert but your funnel doesn’t guide them properly.
Think of GA as your diagnostics tool. Before redesigning your website or increasing ad budgets, ask it what’s really happening.
Hotjar: The Behavior Decoder
If Google Analytics is the “what,” Hotjar is the “why.”
Hotjar gives you heatmaps, scroll maps, recordings, and feedback surveys that expose how users feel while navigating your site. You can almost sense the friction — the confusion, hesitation, or frustration — because you’re literally watching it happen.
Heatmaps Reveal Hidden Patterns
You might discover:
- Users scroll only 30% down your homepage
- People completely ignore your CTA
- Everyone clicks the same section expecting more info
These are not guesses — these are behavioral truths.
Imagine a small fashion brand realizing that shoppers spent more time on the “material” section than the “new arrivals.” That insight changed their entire content strategy — storytelling around sustainability became their new growth lever.
Session Recordings Expose Real Behavior
Watching how people move, hesitate, or abandon forms teaches you far more than surveys ever could.
One brand noticed users repeatedly zooming into product photos — a sign their images weren’t detailed enough.
Providing higher-resolution photos boosted cart completions by over 15%.
Feedback Tools Humanize Your Data
A simple “What stopped you from checking out today?” prompt often reveals gold.
Most brands never ask. The ones who do? They iterate faster and grow smarter.
How Analytics Supercharges Your Digital Marketing Strategy
Here’s what most brands miss: analytics isn’t just a website check-up. It directly fuels your SEO, competitor analysis, ads, and content strategy.
SEO Insights Through Analytics
You’ll uncover which pages attract long dwell time — a signal of relevance — and which pages need rewriting. Analytics becomes your SEO competitor insights tool by showing how your audience behaves compared to your rivals’ strategies.
Better Ads Through Behavioral Understanding
Before scaling campaigns, analytics helps you optimize landing pages first. Why outspend competitors when you can outsmart them with performance data?
Smarter Content Strategy
If Hotjar shows users hovering more over FAQs, guess what? They’re craving clarity.
If GA shows recurring traffic from a particular blog, double down on that topic cluster.
Analytics reveals the emotional journey your users take. Your job is to meet them where they are.
Turning Insights Into Action — Where the Real ROI Lives
Insight without action is just information. But when you combine both tools with strategic thinking, your website shifts from passive to powerful.
For example:
A boutique coaching brand noticed through GA that 60% of traffic came from mobile but their workshops page wasn’t mobile-friendly. Hotjar recordings confirmed frustration — users pinched and zoomed repeatedly.
Fixing the layout increased signups by 33% in three weeks.
This wasn’t guesswork. It was empathy powered by analytics.
And that’s the real advantage: you stop reacting blindly and start designing intentionally.
The Future: Analytics + Human Interpretation
AI tools will become smarter, dashboards more automated, and insights more predictive. But the human element — intuition, creativity, empathy — remains irreplaceable.
Data tells you what people do.
But your understanding tells you why they do it and how to serve them better.
2025 is the year brands realize that analytics isn’t cold or robotic — it’s the closest you’ll ever get to hearing your audience think out loud.
Conclusion: Outsmart With Insight, Don’t Outspend With Guesswork
At a time when every click matters and attention is fleeting, the brands that win are the ones who listen deeply.
Analytics isn’t just about dashboards — it’s about designing experiences that respect your users.
If you want a website that converts, you need clarity, curiosity, and the courage to test, measure, and optimize.
At Edubytes Booster, we help brands turn analytics into action — and action into meaningful digital growth.
Let’s decode your website’s potential together.
📞 Want to talk to an advisor?
Drop us a message at edubytesbooster@gmail.com or Book a free call →
+91 9123756080
Follow us for updates, news, and more information’s:
Instagram | LinkedIn | Facebook | YouTube — @ Edubytes Booster
FAQ’s:
1. What is the difference between Google Analytics and Hotjar?
Google Analytics shows you what users do on your website — pages viewed, traffic sources, bounce rates, and conversions.
Hotjar shows you why they behave that way — through heatmaps, scroll maps, session recordings, and surveys.
Using both tools together gives a full picture: data + behavior insights.
2. How can Google Analytics help improve my website performance?
GA4 reveals which pages attract traffic, where users drop off, which channels convert best, and how people move through your site. With this data, you can optimize navigation, improve content, fix bottlenecks, and create landing pages that convert at a higher rate.
3. What are Hotjar heatmaps, and how do they help?
Hotjar heatmaps visually show where users click, scroll, or ignore.
This helps you identify:
- CTA buttons no one notices
- Confusing layouts
- Content placed too far below the fold
- Sections people interact with the most
Heatmaps make user behavior obvious and actionable.
4. How do I know which pages on my website need improvement?
Start by checking GA4 for pages with:
- High bounce rate
- Low engagement time
- Weak conversions
- Drop-offs in user flow
Then, run Hotjar heatmaps or recordings on those pages to see what’s causing the friction.
5. Can Hotjar recordings really help increase conversions?
Yes. Watching real users interact with your pages reveals hidden issues — confusing buttons, slow-loading sections, broken forms, or unclear messaging.
Brands often find simple fixes (like repositioning a CTA or improving mobile layout) that boost conversions by 10–40%.
6. Should small businesses use Google Analytics and Hotjar together
Absolutely. Both tools are beginner-friendly and offer free plans. Small businesses benefit the most because they usually don’t have huge budgets — insights from GA and Hotjar help them optimize smartly instead of spending blindly.
7. How often should I review analytics for website improvement?
Most growing brands review data weekly, and run deeper audits monthly.
A good routine is:
- Weekly → traffic, conversions, user behavior
- Monthly → heatmaps, funnels, drop-off points
- Quarterly → full website performance + strategic adjustments
Consistent monitoring helps you spot problems early and make improvements before they affect revenue.